What Makes Stocks Go Up?
If you read the title of this and are hoping for a magic formula that mints money, then read no further. You’re not going to find what you’re looking for in here.
Both stock prices and changes in stock prices can be deconstructed into simple mathematical terms. In this post we’ll walk through these basics.
Outline for this post:
- What is a stock price?
- What causes stock prices to change?
- What matters more - EPS growth, or multiple contraction?
- How can investors tell what expectations are 'priced-in' to a stock?
- What can investors do about this?
- Summary
1: What is a stock price?
The value of a financial asset, such as a stock, is the present value of future cash flows available to the owners of that asset.
A stock price is the market’s current estimate of the net present value (“NPV”) of all the future cash flows available to the owners of that business (i.e. shareholders).
Note the difference between price and value: value is the actual present value of a stock’s future cash flows (which is unknowable with precision), whereas price is the market’s current estimate of that value.
The buy & sell actions of investors set prices for publicly traded companies on the stock market – this is supply & demand at work. Market participants individually assess the magnitude and timing of cash flows, as well as the appropriate rate to discount those cash flows. The market price informs us of investors’ aggregate expectations for those factors (i.e. the magnitude and timing of cash flows as well as the discount rate).
If the market believes that the net present value of Company X’s cash flows is $100,000, then the stock’s market capitalization will be $100,000. If there are 100 shares outstanding, then the stock’s price per share is $1,000 (i.e. $100,000 market cap divided by 100 shares outstanding).
This discounted cash flow (“DCF”) value can be expressed as the product of a company’s earnings per share (“EPS” i.e. total earnings divided by the number of shares outstanding) and the multiple of those earnings that investors are currently prepared to pay (the “price/earnings” or “P/E” multiple)[i].
If Company X’s EPS next year is expected to be $100, the P/E multiple is 10x (i.e. $1,000 stock price divided by $100 of earnings).
The inverse of the P/E multiple is the E/P, which is the earnings yield. Company X’s earnings yield is 10% ($100 of EPS divided by $1,000 share price).
2: What causes stock prices to change?
A stock goes up when EPS rises, the P/E multiple expands, or both[ii].
What makes EPS rise?
EPS rises when one or more of the following occurs:
- Revenue grows
- Margins expand
- The number of shares outstanding is reduced (due to the company repurchasing its shares)
Revenue growth and margin expansion are both a function of return on incrementally invested capital (“ROIIC”) and the reinvestment rate. I’ll elaborate on these points further below.
Share repurchases occur at the discretion of a company’s board of directors and management team.
What makes the P/E multiple rise?
P/E multiples rise when the perceived DCF value of a business increases relative to nearer-term earnings. Investors’ DCF projections of a business rise when one or more of the following occurs:
- Investors believe the rate of earnings growth in the future will be higher than they had previously expected
- Investors believe that ROIIC will be higher in the future than they had previously expected (either due to expectations of higher future margins or expectations of higher ‘capital velocity’)
- The expected timeframe during which the company will earn ROIIC above its cost of capital (“weighted average cost of capital” or “WACC”) increases. This is known as the competitive advantage period (“CAP”)
- Broad-market discount rates fall due to a lower risk-free rate (US Treasury bonds are typically referenced as the ‘risk free rate’)
- Company-specific discount rates fall due to investors having more confidence in the company’s future earnings streams than they previously had. Investors believe that uncertainty has been reduced.
We can break down stock returns visually:
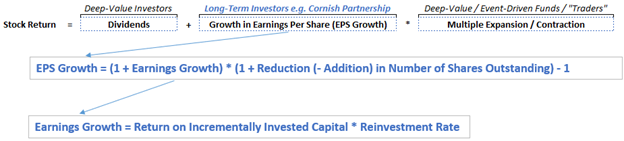
In a future post I’ll demonstrate the relationship between multiples, returns on capital, reinvestment rate, growth and value in more depth. But for now let’s stay focused on the top part of that visual:

3: What matters more – EPS growth, or multiple expansion/contraction?
Let’s use a simplified DCF analysis to see what IRR (internal rate of return) and MOIC (multiple on invested capital) an investor generates investing in a company whose multiple gets cut in half (from 30x to 15x), with the following characteristics:
- EPS growth is 20%
- 10% of EPS is distributed annually as dividends
- The holding period is 3 years
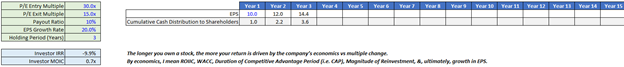
The 3-year IRR is -9.9% and MOIC of 0.7x.
Now let’s look at the IRR for the same company when the investor’s holding period is 20 years, rather than 3 years:
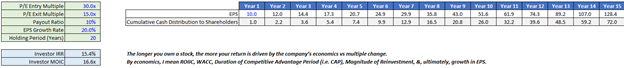
The IRR is 15.4%... The IRR is closing in on the EPS growth.
And now for a 99 year holding period:
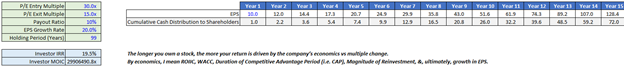
For a 99 year holding period, the IRR is 19.9% - virtually identical to the EPS growth. Of course, it would be very impressive if a business was able to sustain 20% EPS growth for a century, but you get the point!
The longer an investor owns a business, the closer the investor’s IRR approximates the EPS growth rate of the business and the less the impact of the change in the company’s P/E multiple.
Predicting what multiple market participants will slap onto a company’s earnings is a form of Keynesian Beauty Contest[iii]. However, it’s an activity you’re forced to engage in if you plan to only hold a stock for a few years.
EPS growth is not forecastable with any precision either, although this activity involves more ‘fundamental’ research than predicting multiple changes. This is the area that business analysts with a long-term horizon should focus on.
4: How can investors tell what expectations are ‘priced-in’ to a stock?
Market prices contain information about investors expectations for the following:
- Growth in EPS (which is a function of returns on incrementally invested capital and the reinvestment rate)
- CAP
- Discount rate
I’ve written two posts that cover this in more detail, Unit Economics and Cohort Retention Curves and What's Priced In.
You can also check out these great resources:
- Michael Mauboussin and Alfred Rappaport’s ‘Expectations Investing’: http://expectationsinvesting.com/
- Epoch Partners’ primer on the P/E multiple: http://www.eipny.com/wp-content/uploads/2019/06/The-PE-Ratio-A-Users-Manual_FINAL.pdf
5: What can investors do about this?
Mauboussin[iv]:
The one job of an equity investor is to take advantage of gaps between expectations and fundamentals. Expectations reflect the future free cash flows a company must deliver to justify today’s stock price. Fundamentals capture the company’s actual results. Tomorrow’s outcomes that are different than today’s perceptions lead to revisions in expectations that are the source of excess returns.
Expectations are like the odds on the tote board that a racehorse will win. Fundamentals are the result of the race. Handicappers know that you don’t make money by picking favorites. You make money by spotting mispriced odds and investing accordingly.”
6: Summary
Economists, it is said, know the price of everything but the value of nothing[v]. Stock prices contain information about investors’ expectations for the future cash flow generation of a business, among other factors. Investors’ one job is to take advantage of gaps between expectations and fundamentals.
If an investor plans to hold a stock for less than a handful of years, the investor’s fortunes will be tied to multiple re-ratings of the stock (absent astronomical growth/decline rates). If an investor plans to hold a stock forever, the investor’s fortunes will be tied to the growth in free cash flow per share of the company (absent bubble-like starting/ending points).
Pick your research focus accordingly.
Business quality is the most important factor in growth investing. By ‘business quality’ I mean the ability for a company to earn high returns on capital, which can be achieved by high sales turnover or high margins (or some combination thereof). Sales velocity aka asset turnover is a measure of how productively a company can use its assets to generate sales. Margin is a function of the difference between total revenues and total costs, where revenues = price * volume. I’ll explore all of this and more in a future post.
[i] For simplicity I use EPS and P/E multiples in this post. The same principle applies for all valuation measures.
[ii] EPS growth is the largest determinant of dividend potential in the long run. For simplicity we’ll be ignoring dividends explicitly in this post. Dividends are a critical component of the value equation (shareholders believe that they will eventually be able to take their percentage ownership of the business’s cash generation out of the business in the form of dividends).
[iii] For a fun read on Keynesian Beauty Contests, read this article by Richard Thaler: https://www.ft.com/content/6149527a-25b8-11e5-bd83-71cb60e8f08c
[iv] https://www.morganstanley.com/im/publication/insights/articles/articles_onejob.pdf
[v] A search on Google informs me that this is an adapted quote from Oscar Wilde, who was referring to cynics, rather than economists.