Unit Economics & Cohort Retention Curves
Churn cannot be reduced to a single number because customer retention is a curve, not a constant.

“The purpose of business is to create and keep a customer.” – Peter Drucker
Thorough business analysis requires understanding a company’s relationships with its customers. Tren Griffin, Bill Gurley, Michael Mauboussin, Dan MCarthy and others have written great posts on the topic of unit economics. However, five subtopics get less attention than they deserve.
Those subtopics are the importance of:
- Churn’s impact on valuation,
- Discounting customer lifetime value when calculating LTV-to-CAC ratios (and ideally avoiding the use of LTV-to-CAC ratios unless at the individual customer level),
- Focusing on cohort retention curves vs viewing churn as a single number,
- Combining price implied expectations with unit economics, and
- Network Health
A pdf version of this post is available here. If the excel picture snippets are hard to read then please refer to the pdf version.
1: Churn Reduces Business Value
Let’s dive straight into an example to demonstrate churn’s impact on business value.
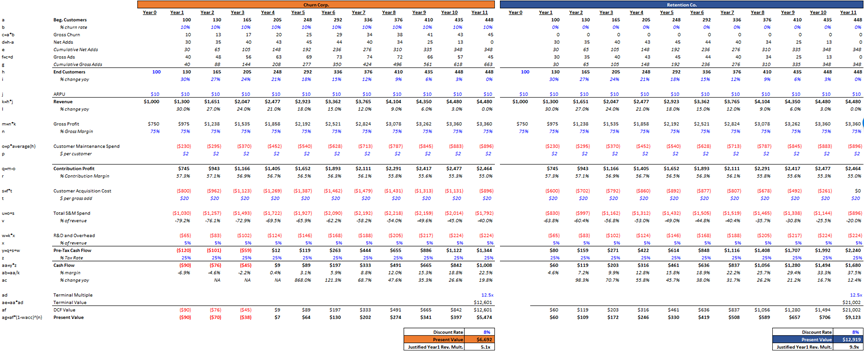
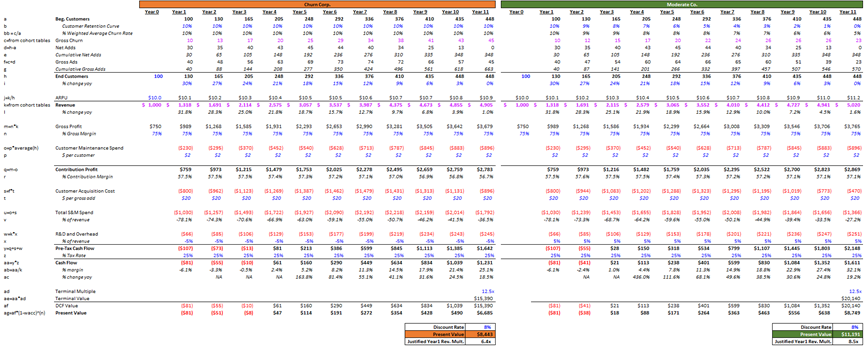
Churn Corp (CC) and Retention Co (RC) are identical in every way except that CC has annual churn of 10% vs RC has churn of 0% (i.e. customers don’t churn from RC). CC and RC have the same ARPU, customer acquisition costs (CAC) per customer, and net customer additions each year.
However, CC must spend more in total sales & marketing and acquire more gross new customers each period to match RC's net customer and revenue growth. By Year 11, CC has made 2x as many gross customer acquisitions cumulatively as RC. CC spends 2x as much on total S&M as RC in year 11. As a result, Churn Corp's cash flow generation is perennially lower than Retention Co's.
Retention Co’s and Churn Corp’s customer counts and revenue figures are identical, yet RC is worth 1.9x the value of CC.
Takeaways:
- CC requires higher S&M expense to generate the same revenue growth as RC. For the same level of growth, CC requires more S&M investment to achieve that growth. RC scales more efficiently despite having the same per-customer acquisition cost as CC. Note that Churn Corp’s higher investment (i.e. higher S&M spend) could equivalently have come in the form of price discounting and lower revenues.
- Churn dramatically changes how much you can rationally pay for a business. In this example, you can pay twice as much for RC based on their year one revenue than you can for CC. Despite having the same forward revenue growth, RC is worth 9.9x year 1 revenue vs CC is worth just 5.1x year 1 revenue. P/Sales multiples and PSG ratios (price-to-sales-to-growth ratios) fail to capture this difference in business value. RC deserves to trade at a higher ending multiple than CC, which would further exacerbate this difference.
- All else equal, higher churn always lowers business value. Companies with high churn must increase the customer value proposition, lest they run with a perennially leaking customer bucket.
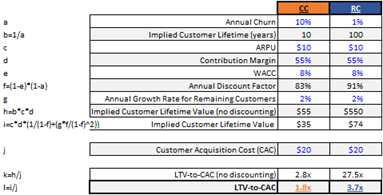
2: Discount LTV to its NPV
Churn Corp still has an attractive financial profile (its churn isn’t thathigh). Based on the customer lifetime value formula, we see that CC has respectable unit economics (in this example we keep CC’s churn at 10% annually but make RC’s churn = 1% so the numbers are easier to work with). We conduct this analysis first with no discounting of cash flows and then with discounting cash flows at the cost of capital (assuming WACC is 8%) and assuming 2% annual growth in cash flows from existing customers:
Takeaways:
- Firstly, note the discrepancy between the LTV-to-CAC ratios with and without discounting. RC’s LTV-to-CAC drops by 87% (from 27.5x to 3.7x) after we account for the time value of money. If a business acquires customers today but that customer relationship only turns profitable many years in the future, that relationship is worth a lot less than if the company receives the same total cash flows from the customer but with the cash flows weighted more heavily to the present. This lesson is closely tied to the concept of duration. The further out a company’s cash flows stretch, the more sensitive the company’s valuation is to changes in the discount rate. As an example, RC’s LTV-to-CAC ratio increases to 6.1x if we lower the discount rate from 8% to 5%. Conversely, if we raise the discount rate to 15%, RC’s LTV-to-CAC declines to 1.9x. CC’s value moves in the same direction but with subtler changes (up to 2.1x and down to 1.2x, respectively) due to the shorter length of the customer lifetime. RC’s LTV-to-CAC ratio is more sensitive to changes in the discount rate than CC’s LTV-to-CAC ratio is, but RC is more valuable than CC no matter what the discount rate is due to RC’s higher profitability (stemming from RC’s ability to retain a higher percentage of its customers than CC can).
- Secondly, note the difference in value between the two businesses. Churn Corp has an attractive LTV-to-CAC ratio, which can be thought of as return on advertising spend (ROAS). With a 1.8x ROAS, CC should acquire as many customers as it can. Despite this, CC is worth just 52% of RC due to having 10% higher churn annually (as we see in the prior section). This is a testament to the power of churn. Note that LTV-to-CAC fluctuates more than company value does. Looking at these two businesses’ undiscounted LTV-to-CAC, one would be forgiven for thinking that RC is worth nearly 10x the value of CC (RC’s 27.5x LTV-to-CAC is nearly 10x CC’s 2.8x ratio). Of course, that is not the case, as we saw in the prior section.
- This analysis only works for companies with a constant churn rate over time. It fails to capture nuances in cohort retention curves.
Let’s now demonstrate this by looking at the cohorts of these two hypothetical companies (switching back to 0% churn at Retention Co):

In the first two sections of the above analysis we see that the two companies’ ending number of customers and revenues each year are identical (remember, CC has more gross churn and has to acquire more new customers to end up with the same number of net customers as RC).
However, when we incorporate 2% annual growth in customer spend for remaining customers and then discount those cash flows back to their present value, RC’s cash flows are worth 2.1% more than CCs over the first 12 years due to compounding larger portions of each cohort over longer periods of time (as shown in the bottom section of the above analysis). This gap increases the further out we project their cash flows. Compounding of each cohort’s CFs over time from the same starting base is not realistic, as eventually older cohorts would be on much higher prices than newer cohorts.
This discrepancy is small. The main difference between CC & RC is not in their revenue generation – it’s in RC’s structurally lower cost base and ability to scale more efficiently. RC’s customers are more captive to RC than CC’s customers are to CC. If RC wanted to, it could presumably spend as much on S&M as CC and build a larger customer base for the same total marketing expense (or perhaps not – maybe RC’s market is more constrained than CC. I’ll leave that part to your imagination.) RC scales more efficiently due to its superior customer retention i.e. it grows more efficiently because it’s better at retaining its existing & its new customers. RC has higher ROIC (if S&M is the main ‘investment’ for these businesses then ROAS is a good proxy for ROIC).
3: Churn is a Curve, Not a Constant
Churn cannot be reduced to a single number because customer retention is a curve, not a constant.
A company's profitability is the sum of the profitability of each of its customer cohorts (minus corporate overhead etc). Investors must ascertain the economics of a company’s customer cohorts to accurately appraise the company’s value. Just as multiples hide the implicit assumptions behind a business’s discounted future cash flows, so LTV-to-CAC ratios bury implicit retention curve assumptions behind a company’s underlying cohorts. Growing ARPU & net subscribers at constant rates similarly buries these assumptions, as we’ll see later when we examine NYT.
Let’s demonstrate this with numbers. We’ll stick with our hypothetical business Churn Corp, but this time we substitute Moderate Co (MC) in for Retention Co. CC has constant churn of 10% whereas MC churns 10% of a cohort in that cohort’s first year, 9% in the cohort’s second year, 8% in their third year and so on until 0% by each cohort’s eleventh year. MC and CC have the same net customer additions each period as one another. MC has the same customer retention curve for all of its customer cohorts. This is to keep the analysis simple & easier to follow (in reality cohorts are unlikely to ever be identical).
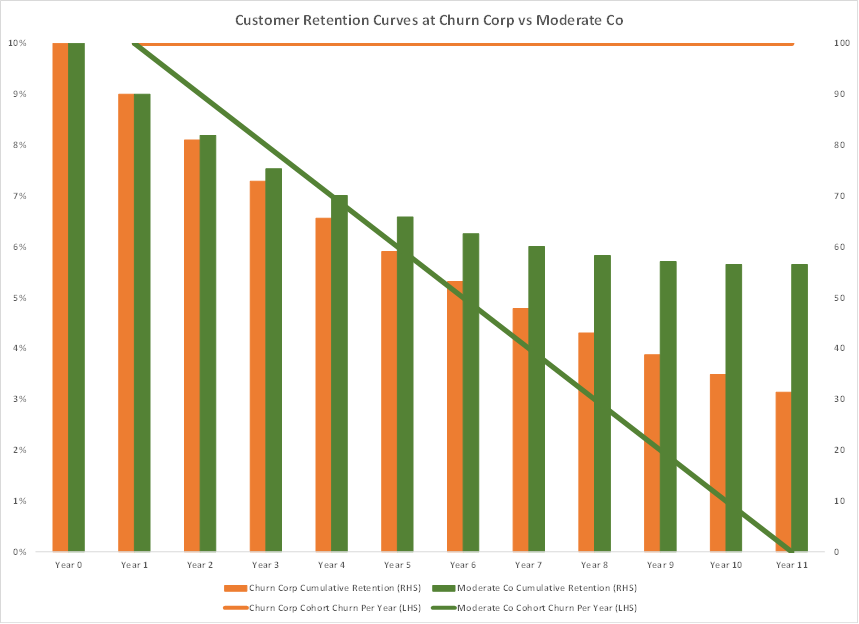
MC has 57% of each cohort’s customers remaining after 11 years vs CC has just 31%.
Let’s take a look at their cohort retention tables and respective DCFs:
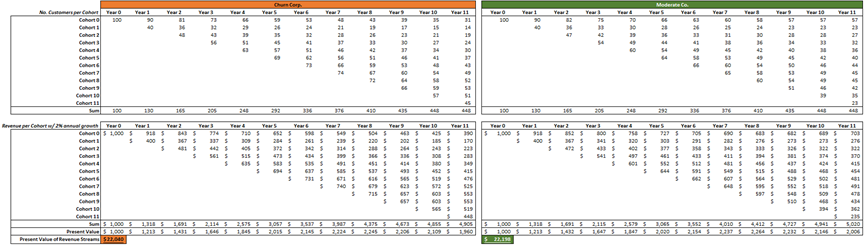
Note that blue cells are hard inputs, black and red cells are formulae and purple cells reference numbers from the cohort tables.
Takeaways:
- The LTV-to-CAC ratio is only reliable when analyzing a single cohort at a time. Any attempt to run an LTV-to-CAC analysis to determine the present value of a business will be inaccurate due to blending multiple customer retention curves into a single churn number. MC’s weighted average churn rate (line ‘bb’) falls each year. An investor that takes the weighted average churn figure and projects it forwards will overstate churn unless (a) projecting growth rates to rise over time, (b) future cohorts have higher churn than past cohorts, or (c) churn rates increase as the customer’s lifetime goes on (the latter of which is an uncommon situation ).
- CC is worth 25% less than MC (assuming the same ending FCF multiple – which is overly generous to CC), despite having identical churn in their first year and having ‘only’ a 5% weighted average churn differential by year 11. Churn that decreases each year is much less detrimental to business value than churn that stays constant at its initial value. Therein lays the power of understanding retention curves vs churn constants.
- MC has 5% weighted average churn in year 11 despite having 0% churn by year 11 of each customer cohort. This is because MC acquires customers in the intervening years which are earlier on in their retention curves. In year 11 many of MC’s customers are newly acquired customers (i.e. only one cohort is 11 years old with 0% churn in that cohort, only one cohort is 10 years old with 1% churn, etc). Younger customers raise the weighted average churn rate for any business with a downward-sloping churn curve. The faster a company grows, the higher its weighted average churn rate will appear (because a higher percentage of its customers will be newly-acquired and thus earlier on (& higher up) in the churn curve), assuming that customer churn decreases over time for each cohort.
- Under this methodology the value of CC is 26% higher than it was in the prior model. This is because it has the same churn dynamics, but we model in 2% growth annually for remaining customers within each cohort. One weakness of this model is that it assumes customer revenue grows each year (presumably from some combination of pricing/usage/mix shift), yet we keep CAC constant. This industry appears to have a benign competitive environment!
- MC is worth 13% less than RC. Most of the value is in the terminal value (cash flow in year 11 is higher for RC than it is for MC because MC acquires customers in year 11 vs RC spends nothing on CAC in year 11). Most interesting is that MC’s revenue is higher in year 11 than RC’s in the same year due to the introduction of the 2% annual growth in revenue from existing customers. However, MC still needs to acquire customers to grow its net customer count at the same rate as RC and thus RC generates higher profits in every year modeled despite lower revenue. RC scales more efficiently than MC, and MC scales more efficiently than CC. RC has the highest return on invested capital, and the highest return on advertising spend.
- Retention curves vary among cohorts, even within the same business. This analysis assumes that all cohorts experience identical retention curves, which is unrealistic. Many products have mandatory initial terms (e.g. 3-year initial subscription term) and so retention curves in the real world are likely to look less ‘perfect’ than what MC has in terms of even (and linear) declines.
4: Combine Unit Economics with Price Implied Expectations
Price implied expectations and unit economics are two powerful concepts Mauboussin has described as “a match made in heaven”[i].
To demonstrate how these tools can be used together let’s examine estimates of what unit economics are being priced into the New York Times’s valuation. More specifically, let’s see how much value the market is assigning to The NYT’s digital news subscription business by using consensus sell-side forecasts.
There are a lot of assumptions required in this section. The important thing is not to get hung up on any one forecast, but instead to perform sensitivity tests on valuation based on changes in each of these assumptions to help us learn about what factors drive the business and what scenarios the market is plausibly pricing into the stock price. The other main lesson from this section should be that you must dive into the data to understand what’s going on.
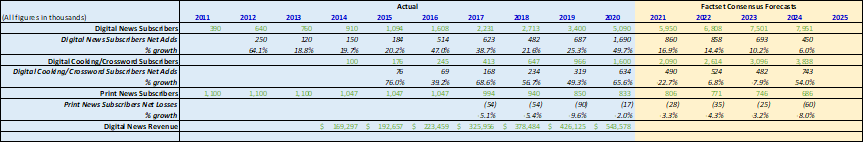
Note that historical print sub figures are my estimates until 2016.
From 2011-2015, net digital news subscriber additions averaged 220k per year. There was a big step-up in 2016 in what became known as “the Trump bump”, when net adds jumped to over 500k for the first time. Many people expected that to be a one-time bump, however net adds continued to grow from there. The average net digital news subscriber adds over the last four years (2017-2020) has been ~870k per year. Consensus is for 860k net adds in 2021 and in 2022. Consensus is for net adds to then average 570k for 2023-2024. Consensus appears to be that 2020 was an aberration.
Looking at the data from a percentage growth perspective we see that consensus is for growth to slow from a 33% last 6-yr CAGR to 17% in 2021 and down to 6% by 2024. 2021 is forecasted to be the slowest growth in the Times’s digital news subscription product’s history, and for growth to slow every year thereafter.
Of course, just seeing the number of digital news subscriber additions the sell-side is assuming is not enough to figure out the implied cash flows from The Times’s digital news subscriptions business. So, how does the number of digital news subscribers flow into valuation?
Here is where our assumptions begin, because Factset does not show consensus digital news subscription revenues.
To figure out the implied cash flows we first need to understand ARPU from each of these products to figure out implied revenue. We then need to make some of our own assumptions about each business line’s cost structure. Again, for brevity’s sake we are just looking at digital news subscriptions in this post.
To figure out implied revenue you can’t just take current ARPU and multiply it by the number of net new adds. Doing so would fail to capture the nuances of The Times’s intro $1/week price discount as well as other factors.
I demonstrate this using a model that assumes that every digital news cohort has the same retention curve. This is for simplicity’s sake – each cohort has a different retention curve. NYT management has called churn ‘a good story’ for The Times. Taking management commentary at face value we would assume that cohort retention rates have improved over time since the launch of the Digital News product in 2011. Of course, without access to internal data (or credit card data), we can’t know what cohort retention has looked like over time.
For the NYT’s customer retention curve, I assume 35% churn in year 1, 15% in year 2, 10% in year 3, 8% in year 4, 6% in year 5, 5% in year 6, 4.5% in year 7, 4% in year 8, 3.5% in year 9, and 3% every year thereafter. I assume a much higher churn rate in year 1 because The Times offers an intro rate of $1/week ($4/month), which is then stepped up to $17/month after 1 year (a lot of customers are actually stepped up to half price during year 2 before being stepped up to full price sometime thereafter, and there are international customers on lower price points). This model fails to capture the nuances of international customers on lower price points.
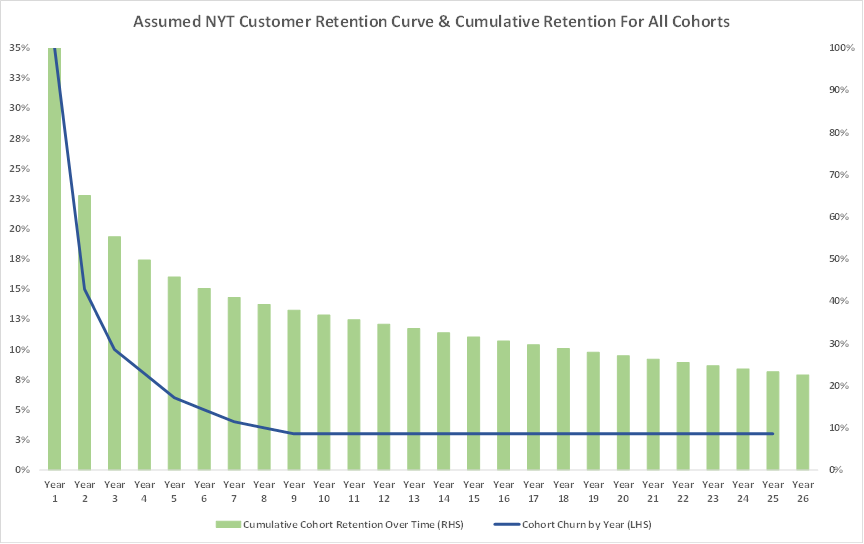
Using this retention curve The NYT has 5-year retention of 43%, 10-yr retention of 36%, and 20-year retention of 26%.
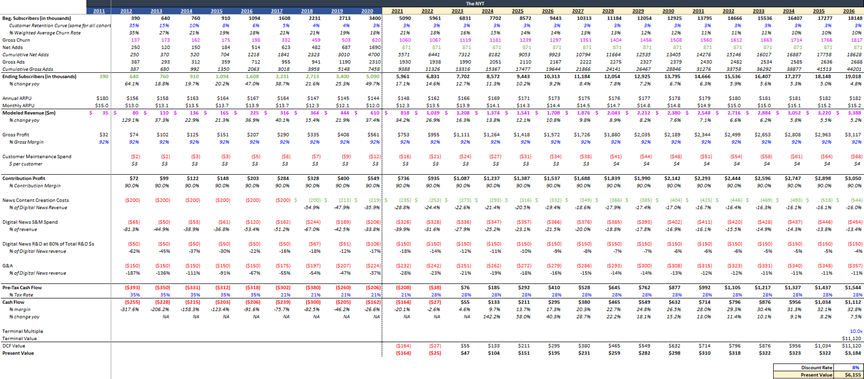
Next, we use these cohort retention curves to model revenue historically using disclosed annual net digital news subscribers. We compare modeled revenue to actual revenue to see if our model fits reality (note that if it’s off you should adjust your retention assumptions). In this case we’re not perfect but we’re also not far off:
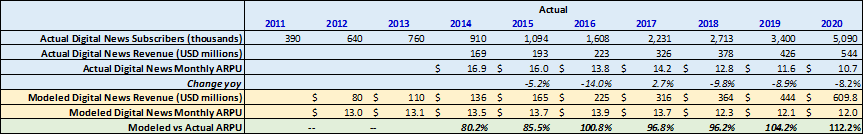
Actual digital news ARPU has declined from >$16 in 2014 and 2015 to <$11 in 2020 (note that I’m taking the average of the current and prior year subscriber numbers. Pricing was $15/month historically so it’s likely this calculation overstates ARPU in 2014 & 2015 due to a lot of subscribers joining later than halfway through the year or some other explanation). Several factors have caused this ARPU decline, including the Times’s expansion internationally, the introduction of the $1/week promotion, and stepping up certain subscribers to half-price for a year or more before full price.
We see in the last line the modeled revenue using my assumed cohort retention curve compared to the actual reported revenue for the digital news subscription business line. It’s not perfect, but is in the right ball-park (I think it’s overestimating 2020 revenue because of a larger contribution from international subscribers at lower ARPU and some combination of overly optimistic cohort retention curves/pricing for domestic customers).
In modeling revenue if you take the current ARPU and multiply it by the number of net new subscribers you’d understate revenue growth. To understand revenue growth we must model this out with cohort retention data like we did in the sections above. We use the same cohort retention curve shown above in this section for NYT:
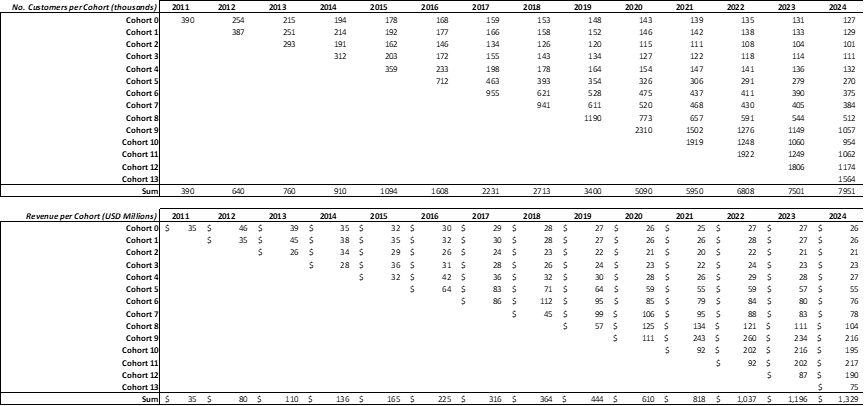
Modeling the business using cohort retention curves rather than blindly multiplying the number of net subscribers by ARPU leads to a >$1bn difference in valuation for the business by 2024. Therein lays the power of understanding cohort retention curves!

Note that in the above I assume that consensus is for the number of net subscribers to stay constant after 2024 (the last year that I have consensus data for). The revenue delta between the two methodologies continues to grow after 2024 because when we have declining cohort churn over time that means a lower percentage of customers are on the intro price promotion and so ARPU naturally ticks higher.
For companies with downward-sloping churn curves like the NYT, deceleration in the growth of number of new customers will be partially offset by growth in ARPU. For the NYT the business is growing revenue faster than it’s growing users due to this growing ARPU. The business is also growing CF/share faster than it’s growing revenue.
As a side note, assuming a $12/month ARPU makes no sense considering full price is $17/month and that I model subscriber growth slowing, so the percentage of the customer base that method implicitly assumes are in their first year in 2024 is too high. I can prove that mathematically:
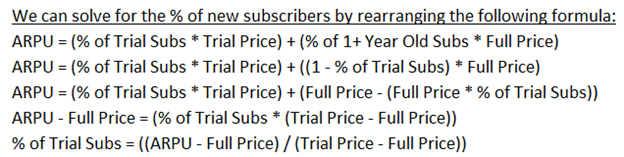
This formula overstates NYT churn because many 1+ year old customers are not on the full $17/month price.
With that caveat, using $12 ARPU and knowing that Full Price is $17/month and Trial Price is $4/month, we solve for ~39% of 2025 subscriber base would have to be in their first year:
($12 ARPU – $17 Full Price) / ($4 Trial Price – $17 Full Price) = 39%
If 39% of subscribers are new in year 2025 despite forecasted net subscriber growth being 0% in 2025, then that means 39% of the entire 2024 subscriber base churned. Given that customer retention is a curve, not a weighted-average constant, that means that the NYT’s churn would be well over 50% on new cohorts. This would be inconsistent with management commentary (which admittedly is extremely vague). Mark Thompson (the prior CEO) has previously stated that they ‘cut churn in half’. If he meant the churn % was cut in half then churn by definition has to be less than 50% (even if it was 100% churn previously then cutting it by half would mean 50% churn now!). Of course, it’s hard to know what actual ‘churn’ Mr. Thompson was referring to – again, churn is a curve not a constant!
As I mentioned above, this formula overstates churn and so we should view the derived weighted average churn rate it spits out as being an ‘upper bound’ on what churn actually is.
Now that we’ve modeled digital news subscription revenue (using cohort retention curves) we can focus on our cost structure assumptions & run a DCF on NYT’s digital news subscription business using consensus net subscribers (and our derived consensus revenue).
In this model I conveniently exclude D&A as well as capex & changes in working capital when calculating FCF. This is to keep things simple (although there is minimal capex required for digital news, and working capital is likely negative for this business as subscriptions are paid up front). The rest of the business (digital cooking/crossword subscriptions, digital advertising, print subscriptions and print advertising) easily covers D&A, and the rest of the business’s expenses.
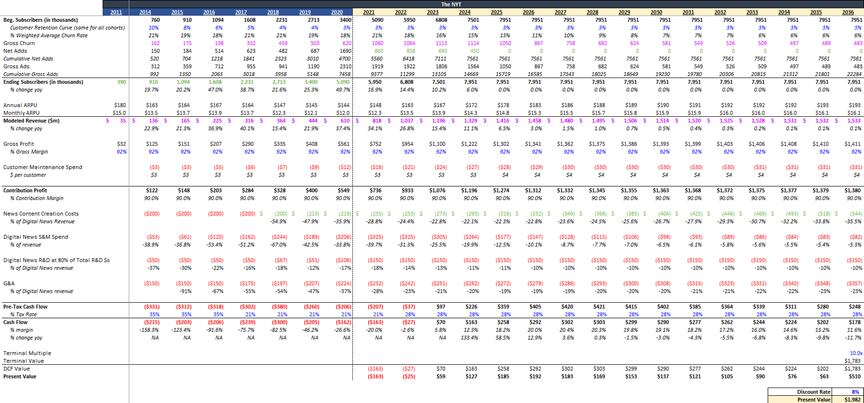
I estimate the rest of the NYT (digital cooking/crossword subscriptions, digital advertising, print subscriptions and print advertising) produced >$600m of FCF in 2020. At a 10x multiple that results in a $6bn EV, which can then be added to the ~$2bn EV of digital news subscription value we derived above. This means that the market is likely pricing in just 7m net digital news subs and for everything else to remain constant. This is the hurdle The NYT must overcome to generate excess returns for shareholders.
A logical next-step/extension is to see what The NYT’s digital news subscription business is worth by itself (i.e. excluding digital cooking/crossword subs and excluding digital ads, print ads and print subscriptions). We’ve seen where the market has set its bar, now let’s see how high The Times can jump.
What follows is how much of our assumptions for that piece of the business are “baked in” to the overall price. In this portion I am comparing the market’s assumptions to my own assumptions.
Valuing the NYT’s digital news subscription business I derive a value of $6bn for the digital news subscription business alone. In this analysis I assume the cohort retention curve above for all cohorts and that The Times adds 871k digital news subs each year (the average of the past 4 years). This leads to 19m digital news subs by 2036. Clearly, this is not priced into the NYT’s stock given this valuation doesn’t account for digital advertising, print subscriptions and print advertising, as well as the value of The Times’s nonoperating assets (which I value at $1.4bn, i.e. $1bn of real estate plus $0.4bn of (excess cash minus pension obligations) results in ~$1.4bn of net nonoperating asset value).
The important assumptions include:
- Net subscriber additions are 871k per year (average of last four years).
- Gross churn curve is same as above.
- $170 in CAC (remaining constant over time), and the gross adds is a plug to match the net adds given the assumed cohort retention curves.
- Historically 90% of total S&M spend and 80% of total R&D went to digital news subscriptions.
- All cohorts have the same retention curve (again, I know this is unlikely to be the case in reality!).
- All digital news subscribers were on $15/week until 2018 when the NYT introduced the $1/week promotion and that every cohort thereafter starts on $4/month and then 50% are stepped up to $10 after 1 year and then $17/month thereafter and the other 50% are stepped up to $17 immediately. I assume that all customers acquired prior to 2018 will be on $15/month until 2022 when they’ll all be stepped up to $17/month simultaneously.
- No D&A, capex or working capital changes (I know, I know).
Of course, every single one of these assumptions is wrong. Hopefully they are roughly right, but certainly they are precisely wrong. They are hypotheses to be tested (placeholders until I gather better data). Despite being wrong, they are important to input & play around with to see which assumptions the business line’s value is most sensitive to (hint: gross adds, gross churn, and pricing. The % of subs on intermediate price points impacts revenue & CF today but the more cohorts NYT acquires and the older the average age of the cohort, the less the impact on initial price discounting). They are also important to compare to historical results to see if my model can “explain” past revenue from this line of business (it does a decent job of this (usually within 5% of actual historical revenue), albeit it overstates 2020 digital news subscription revenue by 12% vs what NYT achieved – likely a result of my churn curve being too flattering and/or my pricing estimates being too aggressive due to international subscribers on lower price points and domestic subscribers being stepped up slower than I model).
My net subscriber addition assumptions suggest The Times would achieve 19m digital news subscribers in 15 years’ time (up from 5m today). Most people have told me this is aggressive. However, assuming 200m MAUs by 2036 (a ~2% CAGR in MAUs, roughly in line with population growth) that implies a 9.5% conversion rate of MAUs to paying subscribers, half of what the WSJ is targeting and slightly lower than Pandora’s current conversion rate of paid-to-free listeners, for example.
We can see from this analysis that a huge driver of value for The NYT is the gross digital news subscriber additions and the gross churn of digital news subscribers. Playing around with those numbers gives us a nice feel for what drives the business’s value and what the business might be worth.
Using the Scientific Method, the next step is to try to “disprove” my assumptions by searching for disconfirming evidence. I’ll leave that for another post!
5: Focus on Network Health - Customers Don't Care About Averages, & Neither Should You
Well done if you’ve made it this far in the blog post. There will be no analytics in this section, you can relax!
I mention network health because it’s important for investors to ascertain through conversations with customers, suppliers, and company employees, as well as through NPS surveys and analyses. In my post on Network Health I offer a working definition of the term:
“The experience of quality that each network node either feels itself or creates for others within the network.”
More importantly:
“This can’t be boiled down to a single number, nor can it be ascertained by looking at the ‘average’ node in a network segment.”
Here’s DoorDash in their S1. They give an excellent example of the concept (they don’t call it “network health” but who cares what you do/don’t call it, what matters is understanding the concept):
“Operate at the lowest level of detail: Averages in our industry are meaningless, it’s the distribution that matters. No consumer cares if our average delivery time is 35 minutes if they received their food in 53 minutes. At DoorDash, we go to the lowest level of detail to understand every part of our system, looking for “and” solutions that fight false “either/or” dichotomies. This is one reason why everyone at DoorDash, including me, tries to step out of our day-to-day roles once a month to do a delivery or engage in customer support, menu creation, or merchant support – staying very close to the needs of those who use our platform is key. We attribute our category-leading spend retention and capital efficiency, in part, to this obsession.”
The jury is still out on DoorDash (at least when it comes to if the stock can offer attractive prospective returns from a ~$60bn starting valuation), but they have the right idea: Customers don’t care about averages, and neither should you.
This concept applies to all businesses – not just marketplace businesses.
When looking at a company’s valuation, don’t obsess over aggregate metrics like LTV-to-CAC ratios because those metrics hide underlying assumptions around cohort retention curves and changes in pricing over time. As we saw with NYT, modeling revenue as historical ARPU * number of users leads to large mistakes in future revenue assumptions because ‘ARPU’ hides the reality that there is no ‘average’ customer. You have to slice & dice customers into multiple segments/cohorts/geographies to get a sense for the business’s current performance & future prospects.
Our goal is to understand a company’s relationships with its customers. Since there are many customers, we must not be led into temptation by ‘one-size-fits-all’ metrics. We must move away from averages to understand a business’s unit economics and network health.
Summary:
Higher churn => lower business value
- High CAC dramatically reduces the price you can rationally pay for a business, all else equal.
- If a company has high churn, it must make up for this shortcoming in other parts of the LTV equation (low CAC, high contribution margins, lower discount rate).
- Low churn is a strong indication of customer captivity and thus competitive advantage.
- In every situation churn reduces the value of a business. However, for every business churn is a part of life and churn should always be taken in context of how many gross adds the customer makes and how efficiently it does so (e.g. what is the CAC). If a business’s revenues are tied to customer usage of its products/services, that business should acquire as many customers as it can and hope for some ‘big winners’.
Discount LTV to its present value when applying the LTV-to-CAC ratio
- Alternatively, one can estimate the IRR that the LTV-to-CAC analysis results in.
- Ideally only use the LTV-to-CAC ratio to analyze each cohort individually, because using LTV-to-CAC for an entire business blends cohort retention curves (see point below). Even analyzing a single cohort with LTV-to-CAC is fraught with this risk since retention over time is a curve, not a constant.
- So, ideally one should only use LTV-to-CAC on a per-customer basis.
Churn cannot be reduced to a single number because customer retention is a curve, not a constant
- Just as multiples hide implicit assumptions of a DCF, so LTV-to-CAC ratios bury implicit assumptions of underlying cohort retention curves and gross subscriber additions. Growing ARPU & net subscribers at constant rates is committing a similarly egregious (& lazy) sin.
- Retention curves are likely to vary from cohort to cohort.
Combine P.I.E. with unit economics
- This takes some fiddling around with and a lot of guesswork if you don’t have access to customer retention data. Standard error is prone to being high. Therefore, run this analysis and then treat the outcome as a hypothesis to be tested – i.e. seek to actively disproveyour findings. Apply the Scientific Method. Run customer surveys. Obtain app download data, credit card panel data (if you can afford it). Show your findings to company management to have them confirm/deny it (in a manner that is legal!) if they’ll speak with you.
- The SEC should mandate disclosure of this information, lest retail investors remain on an uneven footing versus professional investors with the resources to spend on acquiring credit card data.
Customers don't care about averages, and neither should you. Pay attention to network health.
- Averages are meaningless – companies must nurture their network health and investors need to pay close attention to this. Network health does not instantly show up in a company’s financial statements, but ultimately this can be the difference between the industry Gorilla and the industry wannabe. Managers and investors must obsess over network health.

To end, I want to highlight some of the shortcomings of unit economics:
Unit economics are an output, not an input.
- The inputs are the customer value proposition, the business’s competitive advantages (or lack-thereof), management acuity & integrity, and corporate culture.
- A high CVP and strong competitive advantages will ultimately show up in the numbers, but strong unit economics will fade over time if the customer value proposition is insufficient, if the company’s competitive advantages are insufficient, or if other companies disintermediate the company through counter-positioning.
Most companies do not disclose adequate information to their investors for investors to understand that company’s unit economics in-depth.
- This gives an advantage to large institutional investors over smaller investors, because large investors are able to spend money on credit card panels and other sources of alternative data that smaller investors do not have the resources to spend money on.
- The SEC (and other agencies abroad) should make these disclosures mandatory given how vital they are in determining business value and given the disadvantage this lack of disclosure puts retail investors at.
High churn is necessary in some businesses – similar to how a high failure rate is necessary (or at least is extremely prevalent) in venture capital. For some businesses if you’re not churning you’re not trying (/acquiring customers) hard enough! When revenues from customers are a function of that customer’s usage of your product/service, it makes sense to acquire as many customers as possible (even if many will inevitably churn involuntarily e.g. due to bankruptcy).
- For example, Shopify has high churn (because many of its small & mid-sized customers go out of business each year) but it also has a few home runs i.e. successful customers that use Shopify will do so more & more as their business scales. For Shopify (and other businesses with similar characteristics such as AWS) the size of the top of the funnel is critical (i.e. how many customers it can attract to its platform), because some customers will be huge winners. It makes sense to spend more money on acquiring a customer than the customer will generate in value for a few years if you view acquiring customers from the lens of acquiring options, some of which will pay off fabulously in the years to come.
- This is not the case in businesses like Netflix where prices are the same for each customer - it only works when revenues from customers are a function of customer size /usage.
- Of course, it’s still possible (or even probable?) to overpay for these options (i.e. customers). LTV-to-CAC (at the customer-level) is important for AWS and Shopify. I just mean that a degree of churn is an unavoidable part of the business (if they’re not churning, they’re not acquiring enough new customers).
- Note that high voluntary churn is never a good thing – you never want to have customers leave you because they find higher value in an alternative vendor. However, involuntary churn is a part of life for most (if not all) businesses.
The only constant is change. Any analysis of this sort needs to be updated regularly.
- Retention curves are likely to worsen over time for new cohorts, just as real estate locations for retailers tend to worsen over time as the retailer expands into less suitable markets than their initial (& well-selected) markets.
There are many others.
- Please refer to Bill Gurley’s ‘The Dangerous Seduction of the Lifetime Value Formula’.
[i] https://twitter.com/mjmauboussin/status/1279106170767192070?s=20